

This feature enables notifications when a translation changes.
GL Strings uses webhooks to notify an application when there is a translation change to a connected project. Each project on GL Strings can configure up to 3 webhook endpoints. These endpoints will receive inbound HTTP(S) requests (also known as webhooks) from GL Strings' servers when there's a translation change as a result of any of the following actions
The webhook is sent 15 minutes after the latest translation change. This means whenever a translation is edited, a webhook request is scheduled to send to all configured endpoints of a given project 15 minutes later. The request will be sent as scheduled unless a new change to translations occurs before the scheduled time, in which case it is rescheduled to be sent 15 minutes later.
Each configured endpoint for a project is sent a request. GL Strings expects the endpoints to respond with a 2xx HTTP status code for the request to be considered successful. If any endpoint does not respond with a 2xx HTTP status code, GL Strings considers it a failed request and will retry sending the webhook after 15 minutes. If the retry fails, an email notification is sent to the project owner.
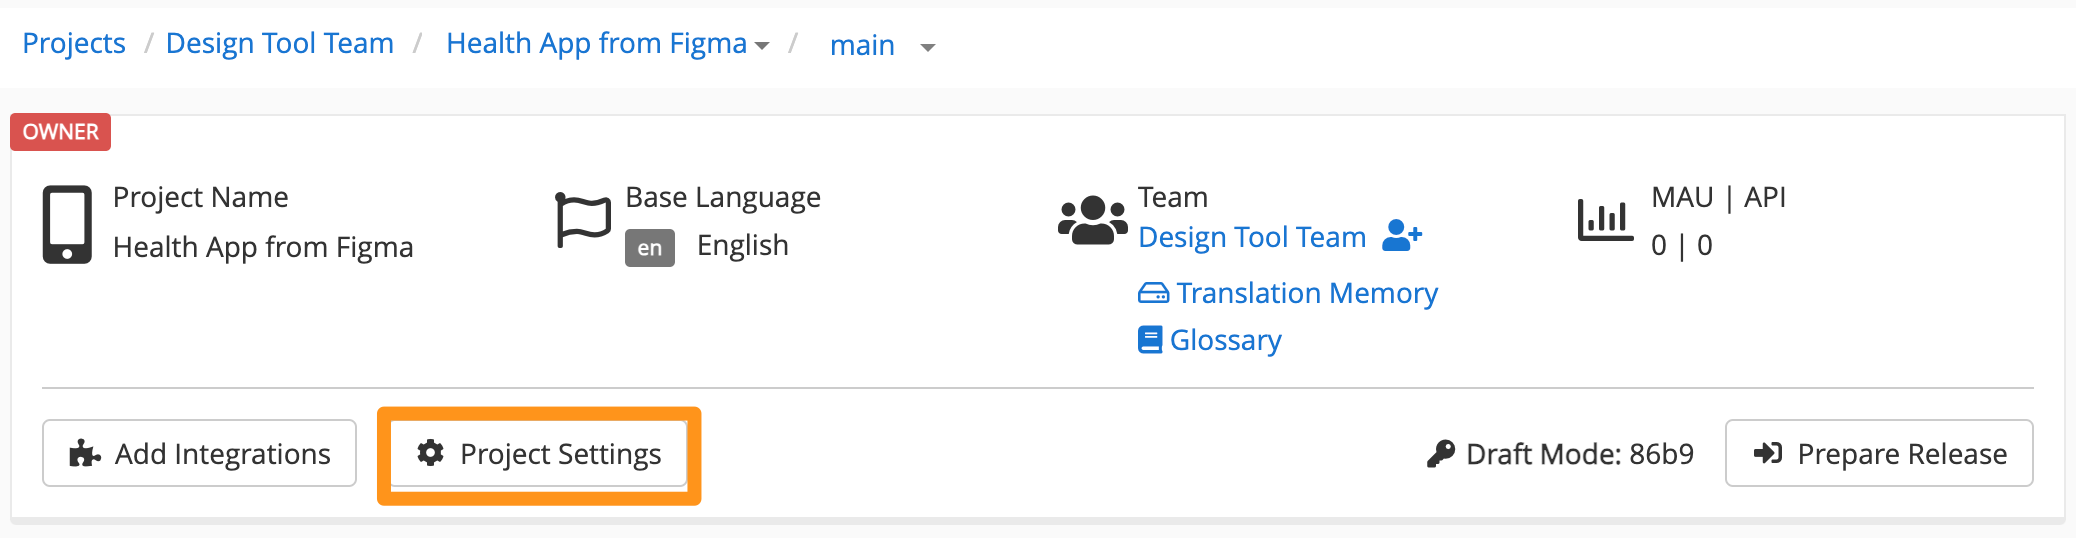
Log in to GL Strings dashboard and navigate to the project. Then click on Project Settings
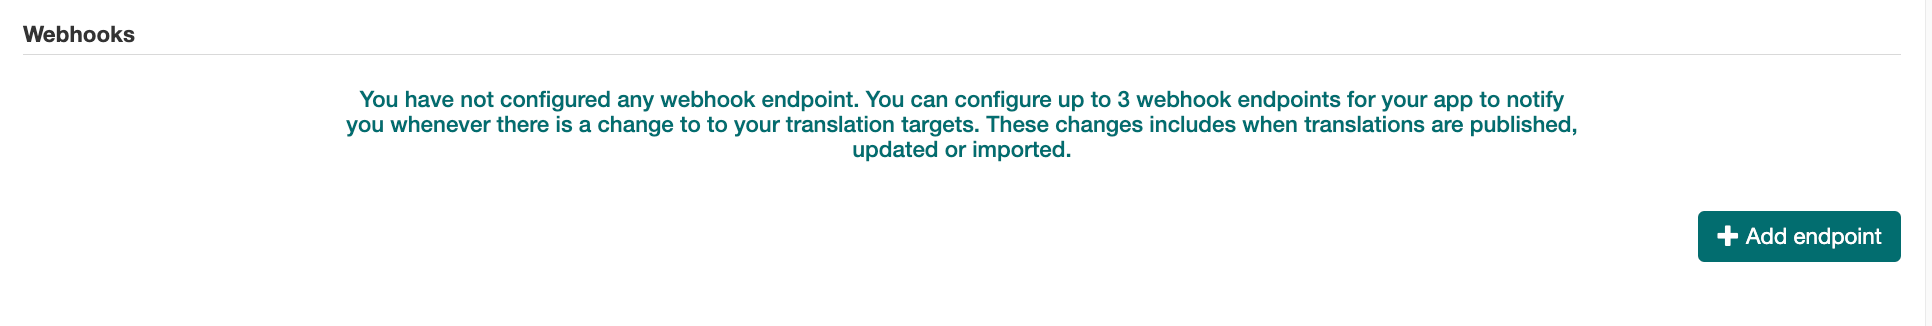
On the settings page, scroll down to the Webhooks section and click the Add endpoint button, this will show a modal where the endpoint values can be entered
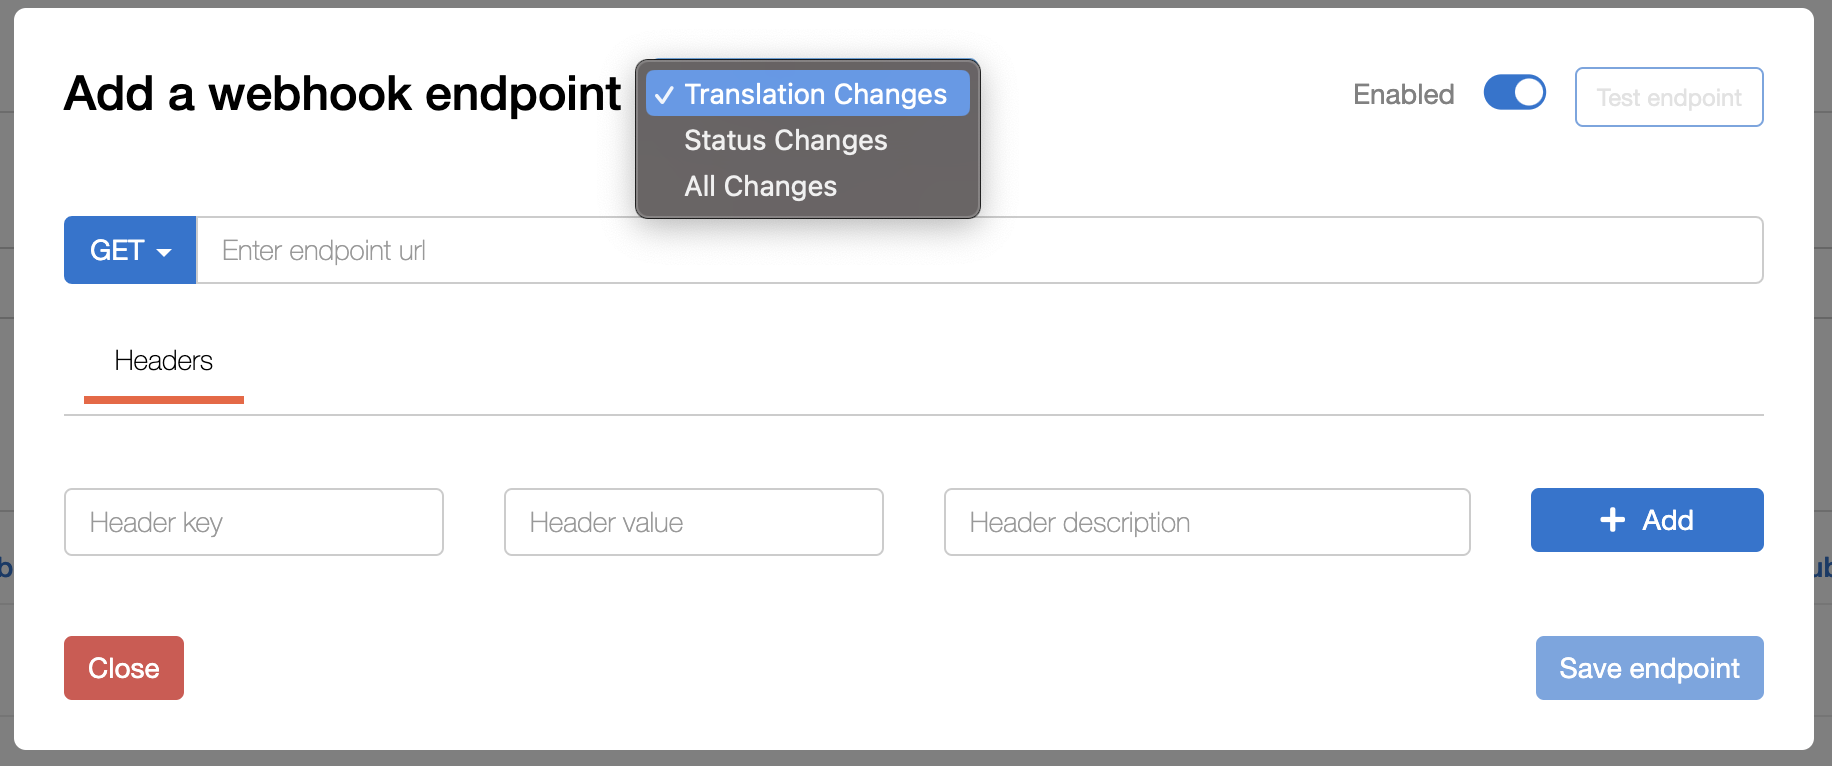
By default Translation Changes is the preselected event type, but this can be changed to Status Changes or All Changes. Event types refers to the activities or actions that will trigger a webhook.
Translation Changes: This refers to changes related to the translation entries. Whenever a translation entry is created, updated, or deleted, it triggers a translation change event.
Status Changes: This event occurs when the status of a translation entry is changed.
All Changes: When this option is selected, the webhook is triggered for any change related to translation entries. This includes all events described in Translation Changes and Status Changes, as well as other activities such as updating translation drafts, tagging entries, linking entries, locking entries, etc.
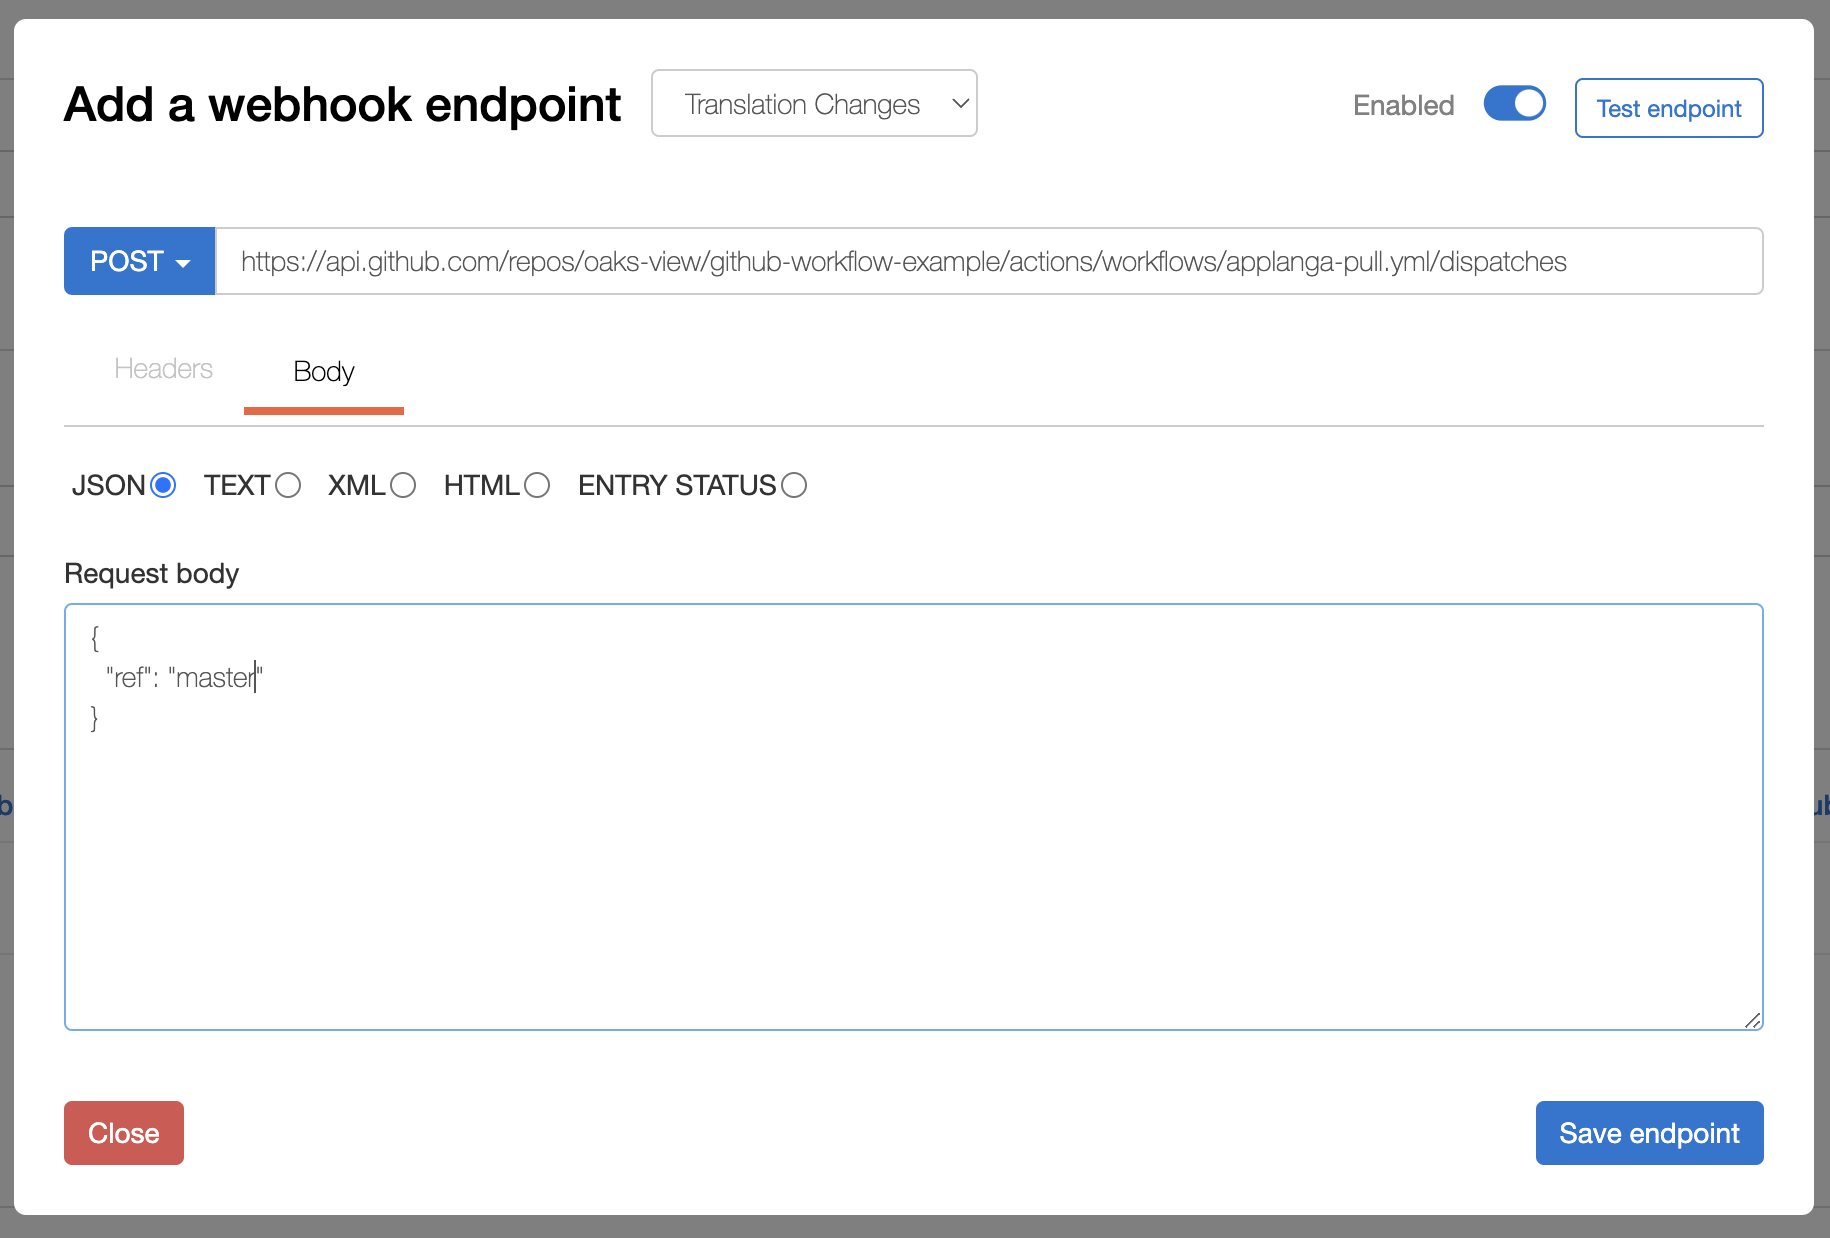
Set the preferred HTTP method and headers as needed. The only required field is the url - an HTTPS url is required. See the following image as a reference
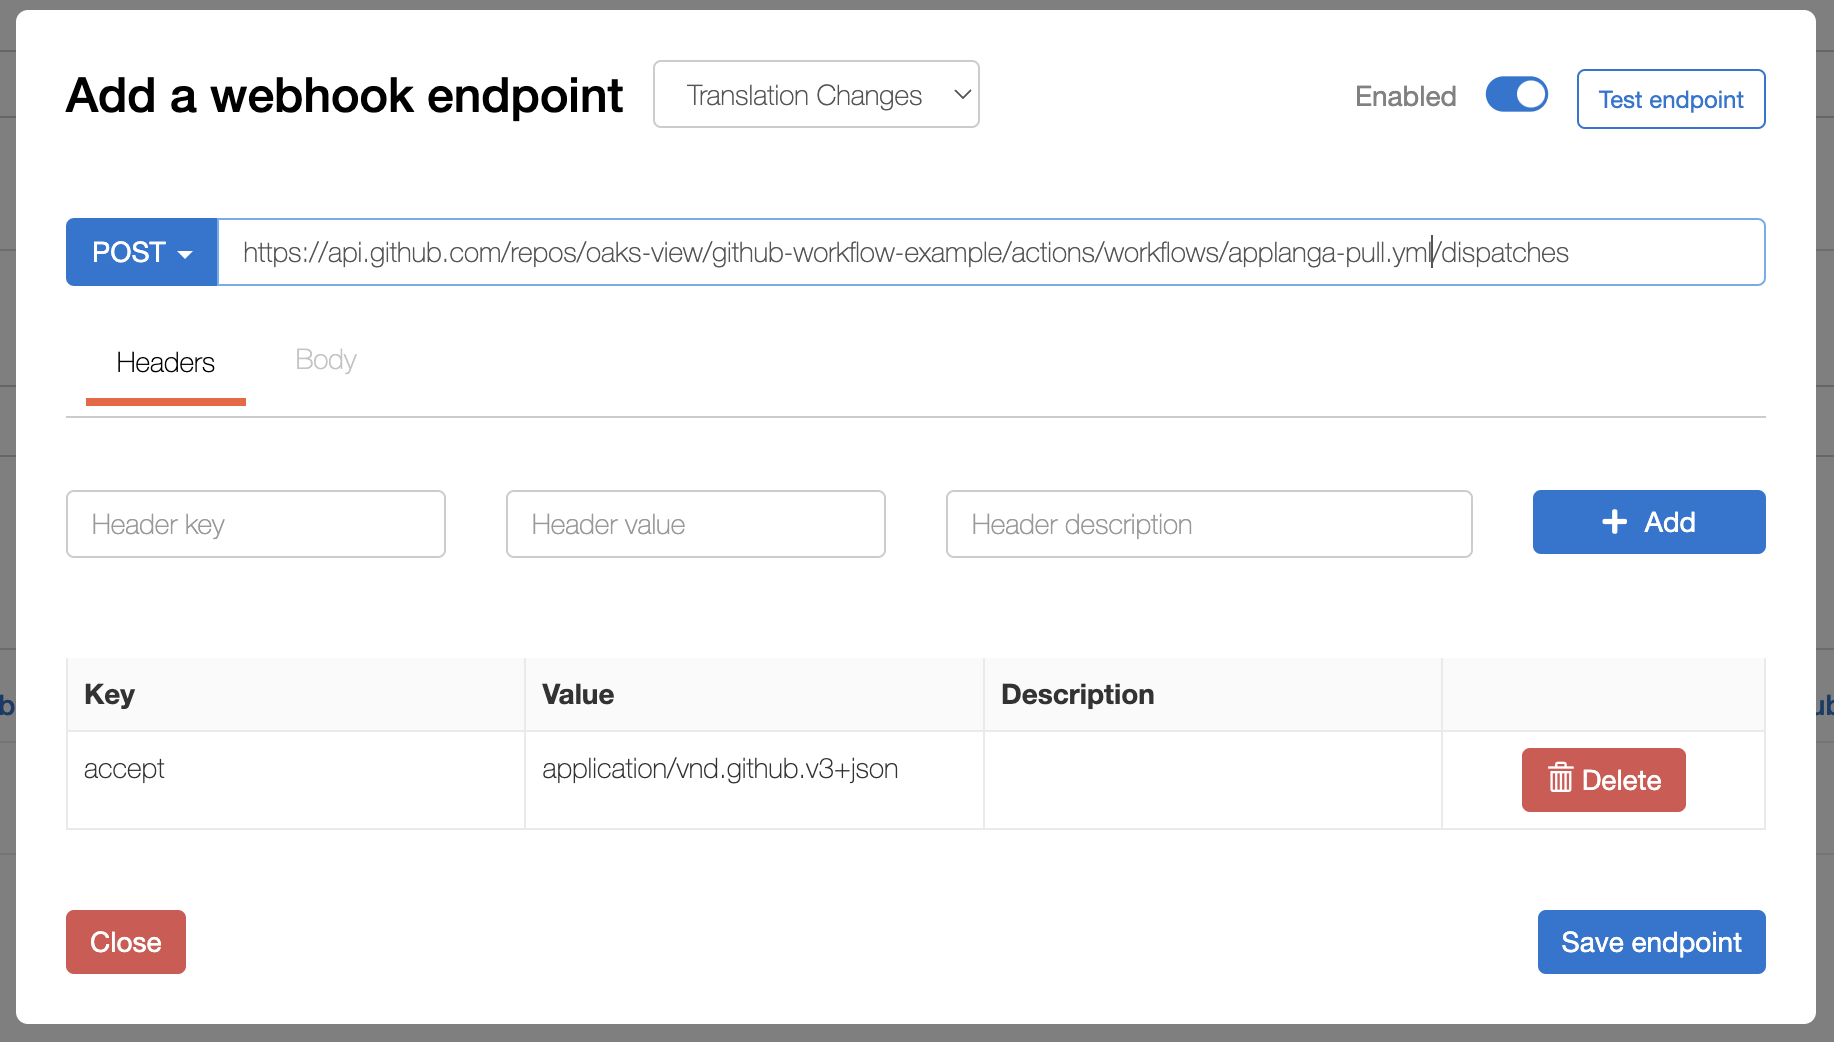
If POST is the selected HTTP method, a raw text body can be added for the preferred content type. Options include JSON, TEXT, XML, HTML or ENTRY STATUS.
For the ENTRY STATUS instead of providing post content on your own the post content will always be the current entry status count in json format. For more information on the entry status count see the Entry Count Api Documentation
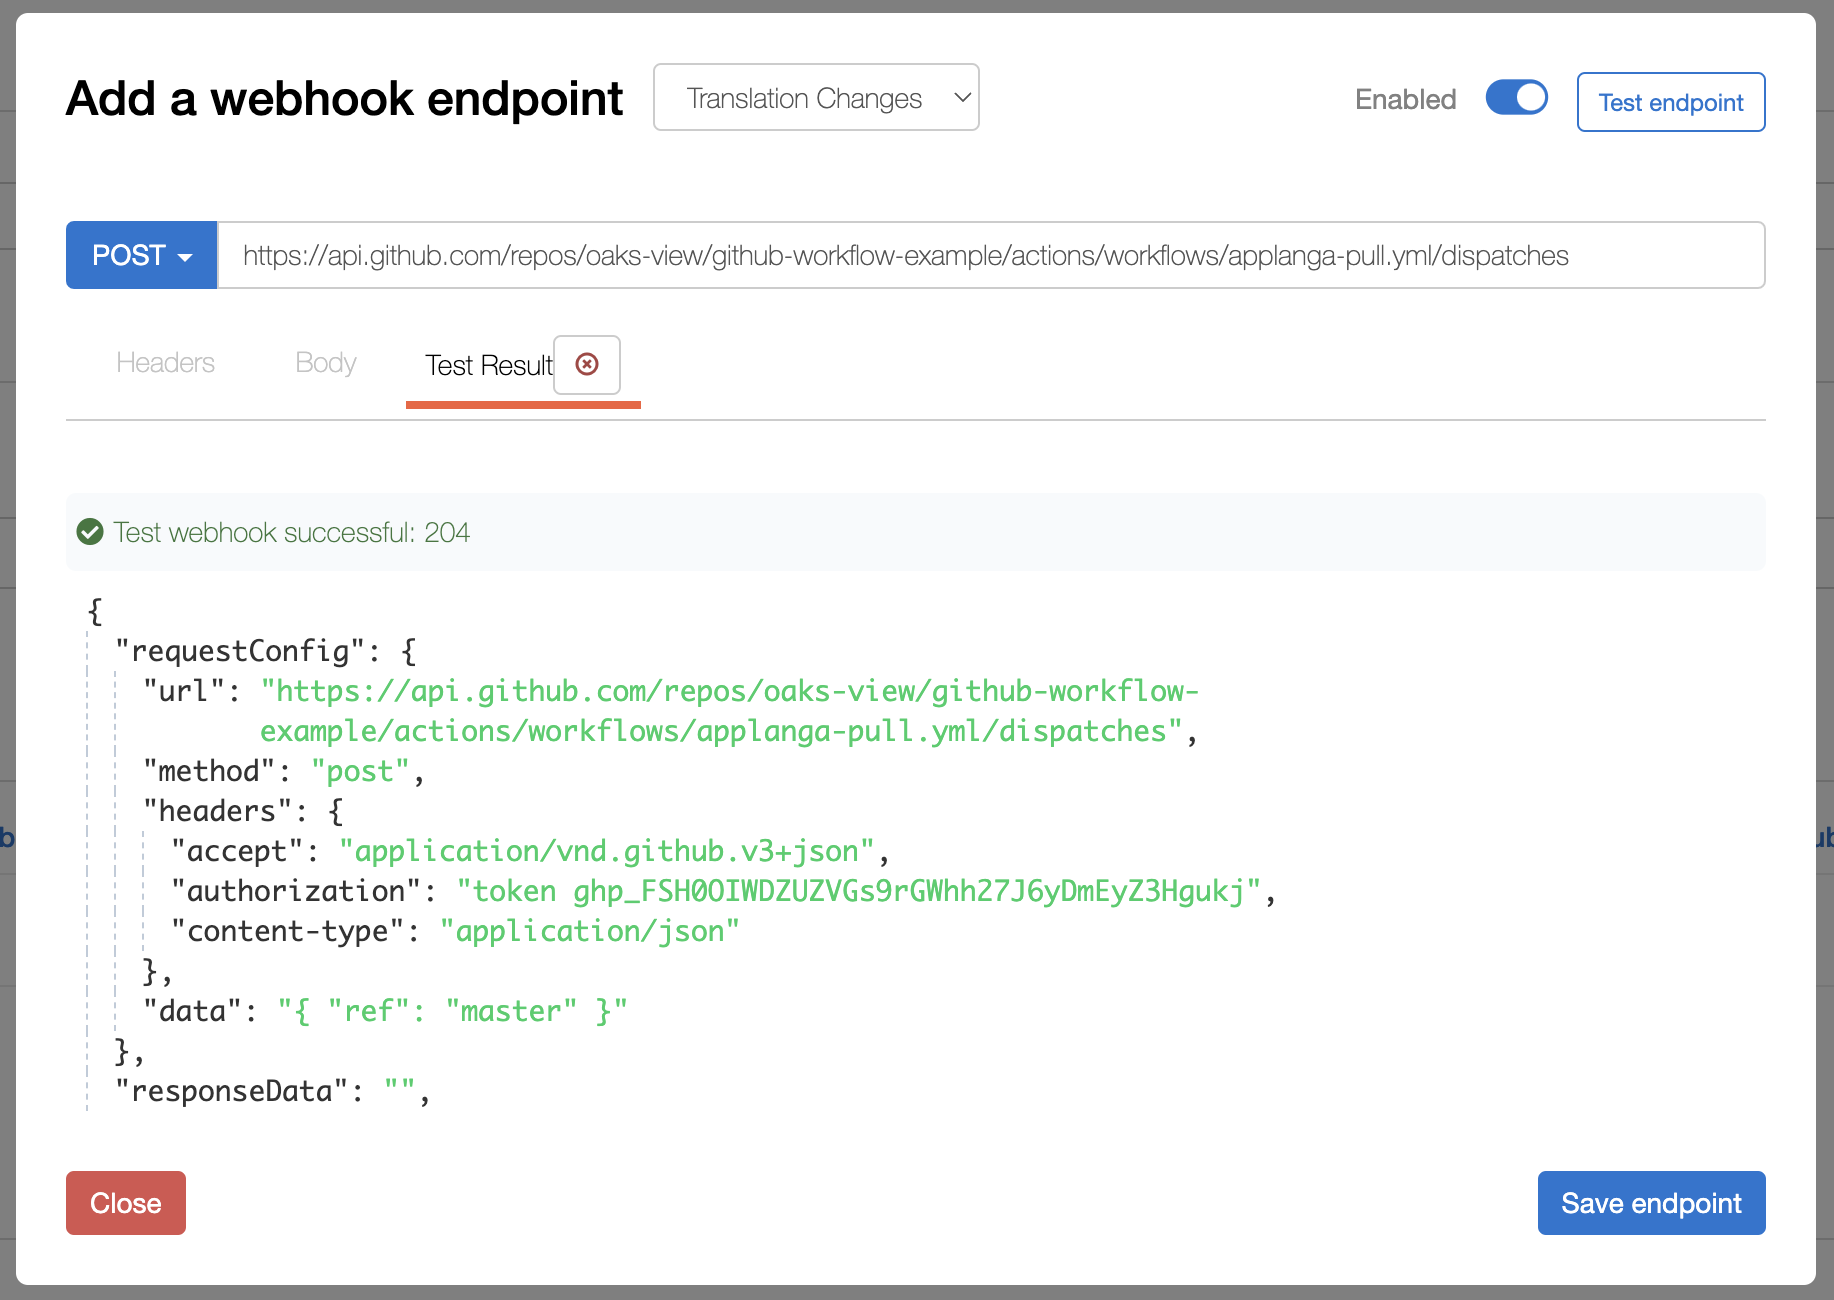
The configured endpoint can be tested to make sure everything works as expected by clicking the Test endpoint button in the top right. If the configuration is correct, the test result should look like the screenshot below
Click Save endpoint